
Industrial Automation · SCADA
Wonderware InTouch: The window into the process that taught factories to look inside themselves
2026-09-06 · 10 min read
By Álvaro AbrilCEO de Geniales.co · Director de KingNews.online
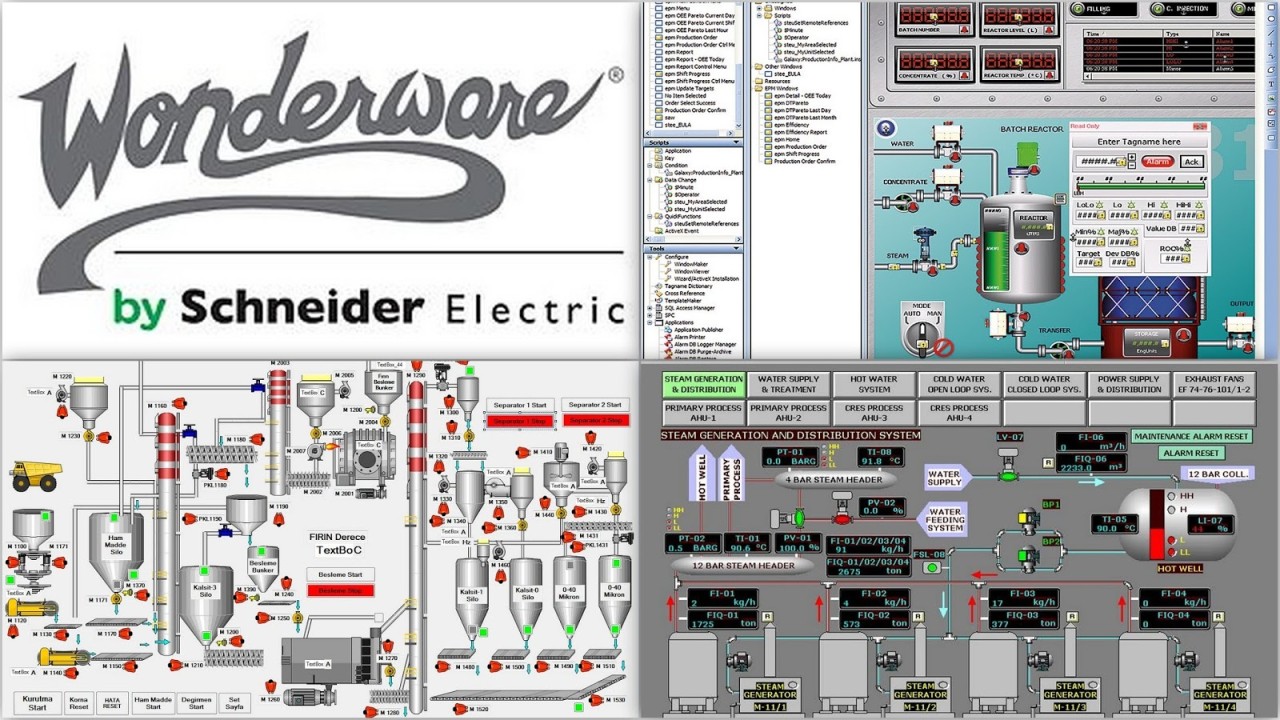
More than 100,000 plants worldwide run on InTouch, the HMI/SCADA born in 1987, which passed through Schneider Electric and is today AVEVA. Its true contribution was not technical: it was teaching engineers to think of the process as a living screen rather than a relay board.
1987: When the Plant Stopped Being a Black Box
Wonderware was born in 1987 in Irvine, California, with an idea that seems obvious today and was almost heretical back then: that an operator could see the industrial process drawn on a PC screen, with animations linked to real PLC variables, without writing a single line of code.
Until that point, plant supervision lived on mimic panels with indicator lights, gauges, and pushbuttons, or on text terminals capable of displaying little more than lists of values. InTouch introduced the concept that would define three decades of automation: the graphical interface as a faithful, animated representation of the physical process.
The company later passed through Invensys, then to Schneider Electric—a phase etched into the "Wonderware by Schneider Electric" logo recognized by any plant engineer—and finally into the AVEVA portfolio, where the product is marketed as AVEVA InTouch HMI. The name changed; the installed base, exceeding 100,000 plants and factories worldwide, remained.
What SCADA Really Is and Why It Matters
SCADA stands for Supervisory Control and Data Acquisition: supervision, control, and data acquisition. It is not the system that executes real-time control—that is handled by PLCs and DCSs, with millisecond cycles and guaranteed determinism—but rather the layer that collects this data, presents it, logs it, and allows humans to intervene.
The classic InTouch architecture relies on three components. The communication servers—the historic I/O Servers and later the OPC and OPC UA standards—communicate with PLCs from any manufacturer. The visualization engine, WindowViewer, runs the screens built in WindowMaker. And the historian records trends, alarms, and events for subsequent analysis.
The central conceptual element is the tagname: each process variable—reactor temperature, hot well level, pump status—is a tag with a name, type, engineering range, alarm limits, and data quality. The tag dictionary is the backbone of the system and, in practice, the semantic map of the entire plant.
| Capa | Función | Escala de tiempo |
|---|---|---|
| Instrumentación de campo | Sensores, transmisores, actuadores | Continua |
| PLC / DCS | Control determinista de lazos y secuencias | 1–100 ms |
| SCADA / HMI (InTouch) | Supervisión, alarmas, tendencias, intervención | 0,25–1 s |
| Historian | Registro y consulta de datos de proceso | Segundos a años |
| MES / ERP | Producción, OEE, órdenes, costos | Turnos y días |
The mechanical mindset: thinking of the screen as the process
Here is the part that is often overlooked. Building a good SCADA is not an exercise in programming or graphic design: it is an exercise in mechanical and process understanding. Whoever designs the screen must understand where the steam flows, at what point a pump might cavitate, what happens if the silo level drops below 15%, and what decision the operator will make at three in the morning with an alarm sounding.
The best-built screens in the industrial world—a steam generation and distribution system with its 4 and 12 bar headers, a batch reactor with its temperature loop, a crushing plant with its chain of silos and separators—are not pretty: they are readable. Each animated element corresponds to real equipment, and each color means exactly one thing.
That discipline explains why the best SCADA integrators often come from mechanical, chemical, or electrical engineering rather than computer science. Software is the easy part. The hard part is knowing what deserves to be on screen, what should trigger an alarm, and what is merely noise that will exhaust the operator until they become desensitized.
The Cardinal Sin: The Alarm Flood
The most common flaw in SCADA projects is not technical; it is a matter of judgment. Alarms are configured for everything, using mindlessly copied thresholds, and the result is a console that triggers hundreds of events per hour. The ISA-18.2 standard and the EEMUA 191 guideline are clear: an operator should not manage more than six alarms per hour during normal operation.
When that number skyrockets, something worse than mere annoyance occurs: the operator learns to ignore the screen. Several of the best-documented industrial incidents of recent decades cited an alarm flood that buried the truly critical signal as a contributing factor.
Alarm rationalization—prioritizing, grouping, suppressing based on plant state, eliminating duplicates—is probably the highest-return work that can be carried out on an already installed InTouch system, and it almost never requires purchasing new licenses.
From the Screen to Data: What Has Changed in Recent Years
Modern SCADA no longer ends in the control room. The data captured by InTouch feeds historians, OEE calculations, shift efficiency reports, predictive maintenance models, and dashboards accessible via web and mobile. This continuity between the sensor and business decision-making is what is known today as industrial intelligence.
Along with that continuity came a serious challenge: OT cybersecurity. Systems designed in the 1990s for isolated networks are now connected to the corporate network. The zones and conduits segmentation proposed by the IEC 62443 standard, strict access control, patch management, and verified application backups are no longer optional.
The rule of thumb is simple: anything connecting upward should do so in a single direction whenever possible. Publishing data to the IT world makes sense; allowing write access from that world to the process demands justification, segmentation, and auditing.
What to Do with the Data Your Plant Is Already Generating
Most plants running InTouch have spent years accumulating historical records of temperature, pressure, flow rate, downtime, and alarms that no one leverages beyond the weekly report. Immediate value lies right there: early detection of degradation in pumps and motors, root cause analysis of stoppages, batch-level energy consumption, and real performance comparisons across shifts.
At Geniales.co, we build precisely that upper layer: plant dashboards and custom applications that read data from the historian—via OPC UA, SQL, or API—and turn it into actionable insights, powered by React 19, TypeScript, TanStack, and PostgreSQL, alongside artificial intelligence models for anomaly detection and forecasting. No touching the control layer: the SCADA continues doing its job, while analytics are layered right on top.
SCADA gave the industry a window into the process. The next step is for that window to also remember, compare, and warn before an issue occurs. The infrastructure is already installed in the plant; almost always, the only missing piece is the layer that turns data into decisions.
Enlaces
Get KingNews in your inbox
Tech and gaming digest, no noise. Unsubscribe anytime.
Want to send us a news story?
Tell us your story. Our editorial team reviews it and gets back to you.
Would you like to advertise with us?
Write to us and we'll send you ad options and audience data.
More stories
Comercio electrónico · Eventos · Colombia
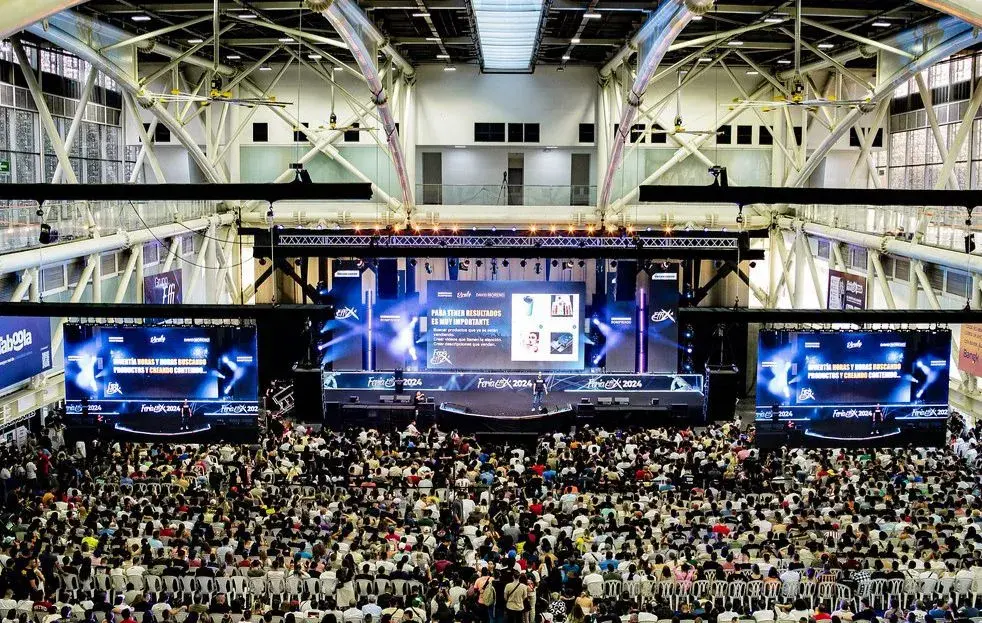
Feria Effix 2026: Medellín se convierte en la capital del comercio electrónico
Robótica · Inteligencia artificial · Sistemas autónomos
La colmena blindada: robots terrestres que podrían comandar enjambres de drones
Agrotecnología · Inteligencia artificial · Ganadería
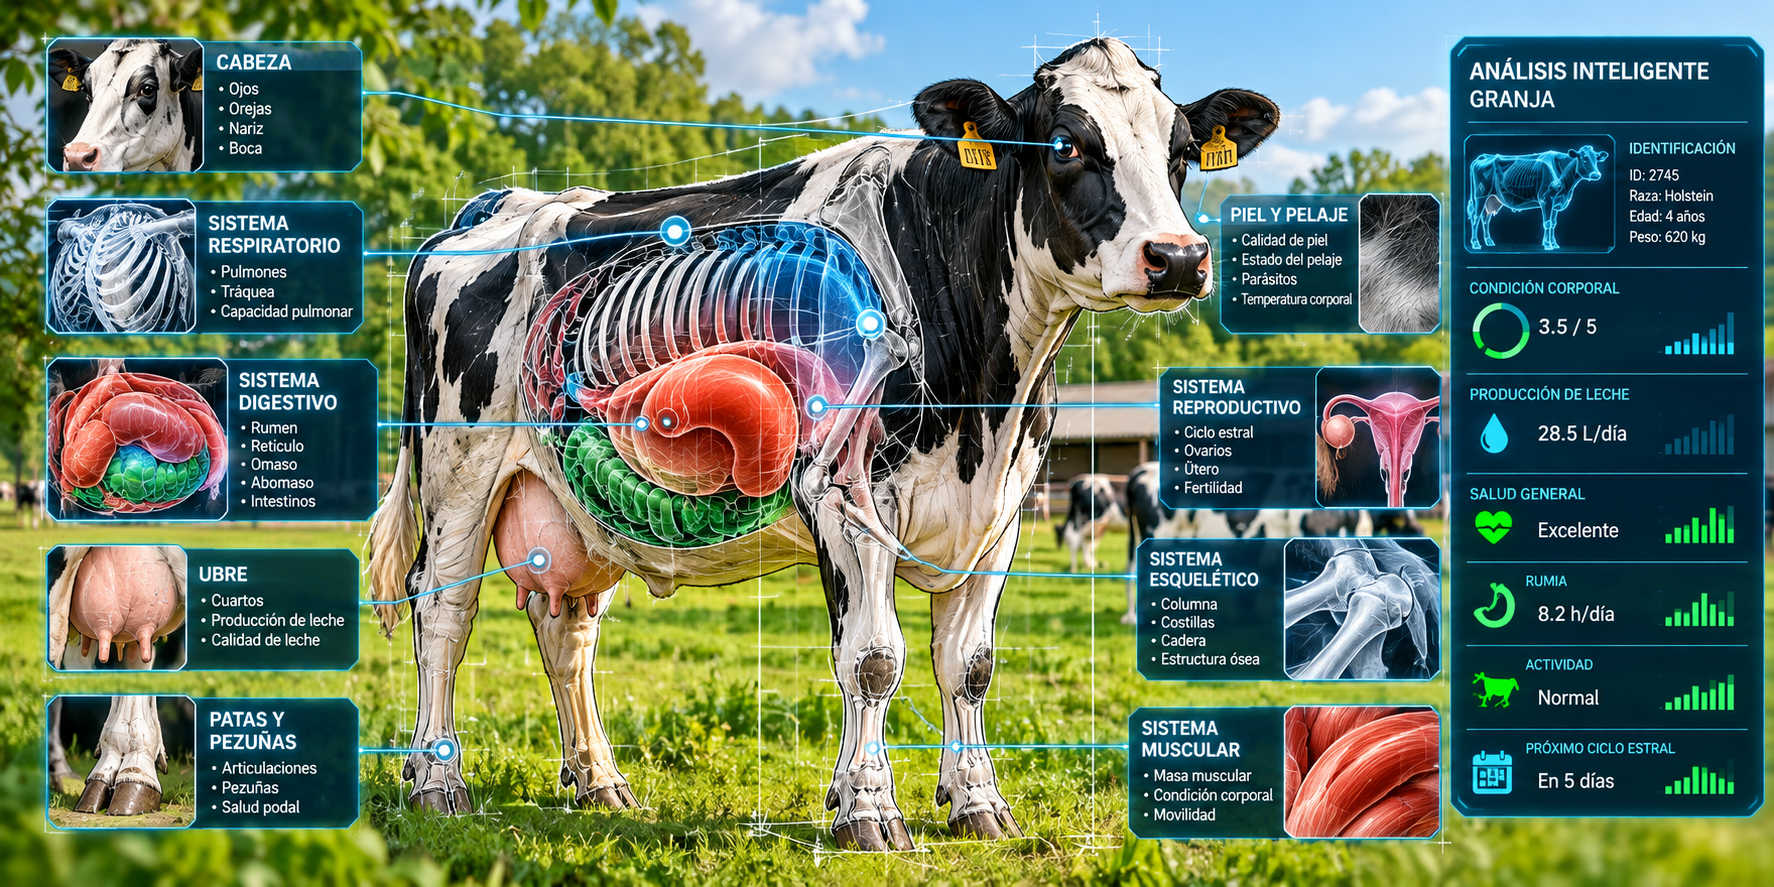
La granja autónoma toma forma: IA, drones y robots llegan al campo

Inteligencia artificial · Empresas · Opinión
BMW adelgaza su dirección con IA: ¿ha llegado la hora del gerente artificial supervisado?
Inteligencia física · Agricultura · Robótica industrial
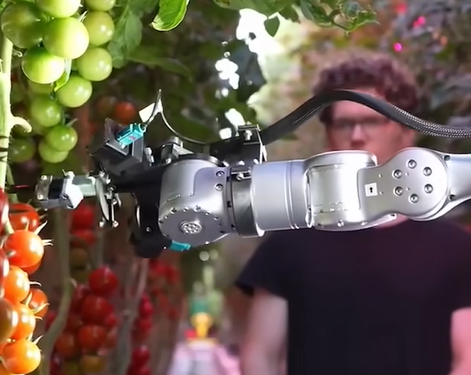
Polybot enseña a un robot a cosechar tomates mirando cómo trabajan los humanos
Inteligencia física · Robótica · Aprendizaje autónomo