
Energy · Global Markets
The Oil That Really Moves the World: Reserves Versus Exports
2026-09-05 · 9 min read
By Álvaro AbrilCEO de Geniales.co · Director de KingNews.online
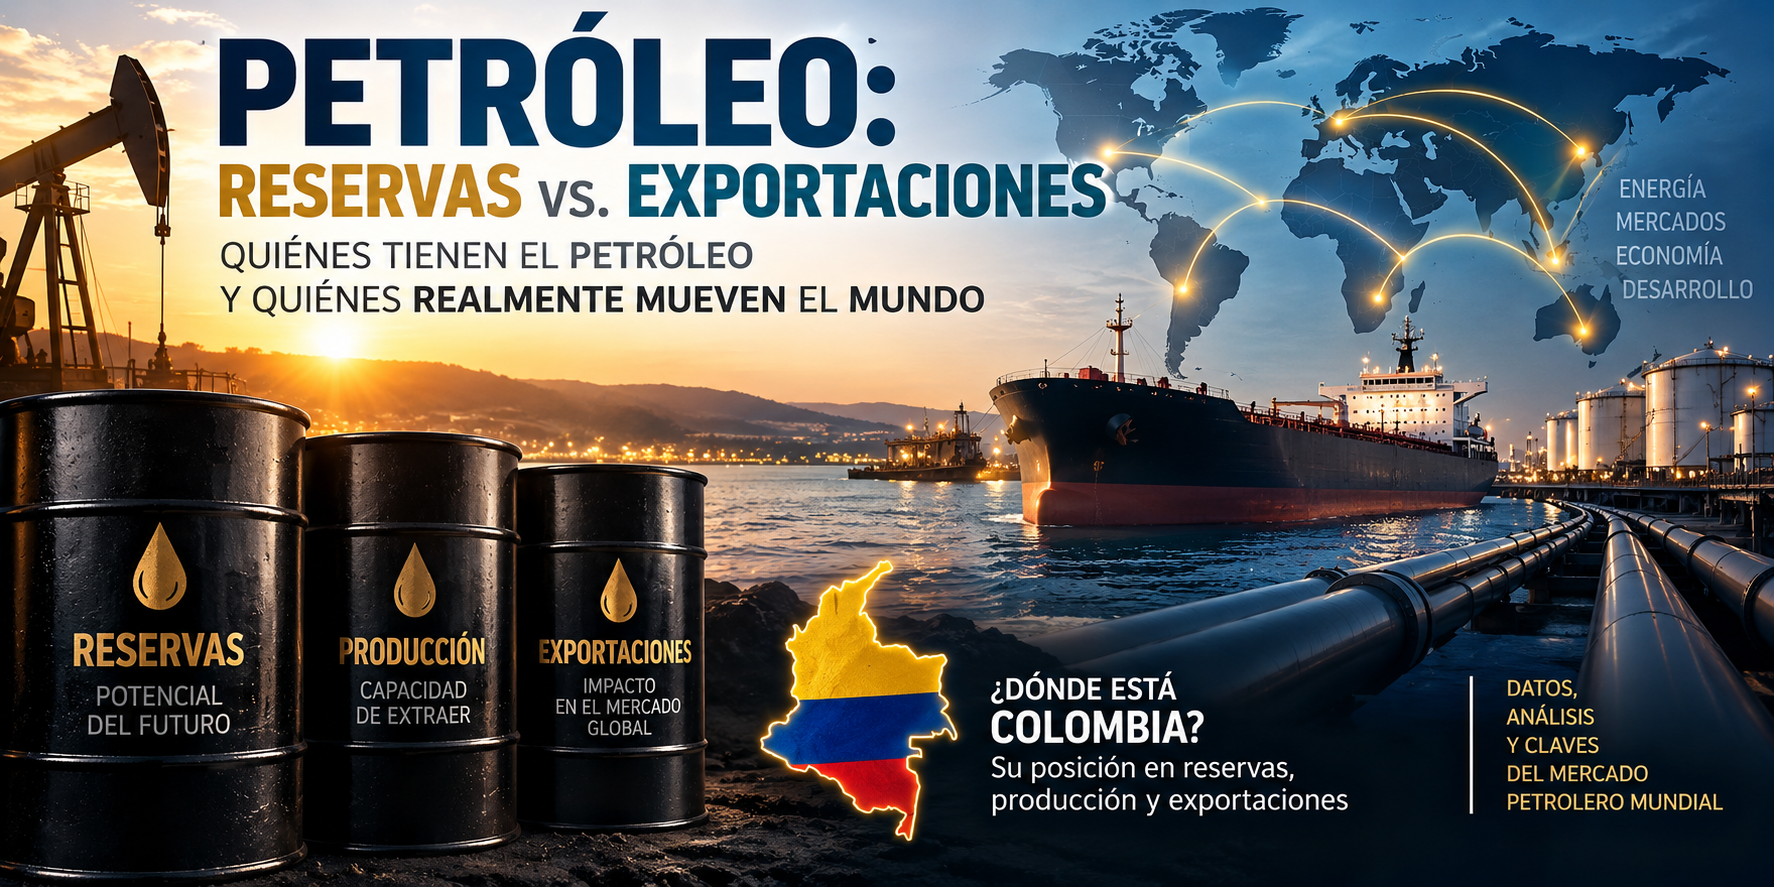
Venezuela leads the planet's proven reserves with 19.3% of the total, but in 2024 it exported barely 656,000 barrels per day. Saudi Arabia, Russia, and the United States are the ones who truly supply the market. Meanwhile, Colombia, ranked 30th in reserves, stands in 21st place as an exporter.
Two Different Maps of Energy Power
When talking about oil, the same ranking almost always appears: the countries with the largest proven reserves. But reserves are only half the story. A country can have enormous amounts of crude oil underground and, at the same time, export relatively little.
The right question, then, is not merely who has oil, but who can put millions of barrels onto the global market every day. They are two different maps, and confusing them leads to mistaken conclusions about who commands global energy.
The figures in this analysis come from the OPEC Annual Statistical Bulletin 2025, with data as of year-end 2024. That year, the world had approximately 1.567 trillion barrels of proven reserves and exported about 43.24 million barrels per day of crude oil, of which 19.01 million came from OPEC members.
The map of reserves: potential power
Proven reserves are the oil that, according to available geological and technical information, is considered recoverable under current conditions and assumptions. They measure accumulated potential, not commercial activity. It is a snapshot of the possible future, not of the present.
On that map, Latin America leads the world thanks to Venezuela, with more than 19% of all the planet's proven reserves. Behind come the giants of the Persian Gulf and Russia.
| Puesto | País | Reservas probadas (millones de barriles) | % del mundo |
|---|---|---|---|
| 1 | Venezuela | 303.221 | 19,3% |
| 2 | Arabia Saudita | 267.200 | 17,1% |
| 3 | Irán | 208.600 | 13,3% |
| 4 | Irak | 145.019 | 9,3% |
| 5 | Emiratos Árabes Unidos | 113.000 | 7,2% |
| 6 | Kuwait | 101.500 | 6,5% |
| 7 | Rusia | 80.000 | 5,1% |
| 8 | Libia | 48.363 | 3,1% |
| 9 | Estados Unidos | 45.014 | 2,9% |
| 10 | Nigeria | 37.280 | 2,4% |
A Methodological Caveat Regarding Canada
The OPEC table used here reports 4,344 million barrels for Canada and clarifies that this figure excludes oil sands. Other international sources do include oil sands and, consequently, place Canada very high in the global ranking, near the podium.
It is nobody's mistake: it is a difference in methodology. And it explains why two equally reputable rankings can tell different stories. Before citing a reserves figure, it is advisable to know what it is counting and what it is leaving out.
The map reaching the market: exports
This is where everything changes. In 2024, around 43.24 million barrels per day of crude oil were exported worldwide. This indicator shows which countries are placing actual volumes beyond their borders and, therefore, have a direct connection to international supply and pricing.
The leader in reserves disappears from the top ten exporters. In its place appear countries whose strength lies in production, logistics, pipelines, ports, and refining.
| Puesto | País | Exportaciones de crudo (mil b/d) | % del mundo |
|---|---|---|---|
| 1 | Arabia Saudita | 6.049 | 14,0% |
| 2 | Rusia | 4.524 | 10,5% |
| 3 | Estados Unidos | 4.109 | 9,5% |
| 4 | Canadá | 3.569 | 8,3% |
| 5 | Irak | 3.364 | 7,8% |
| 6 | Emiratos Árabes Unidos | 2.717 | 6,3% |
| 7 | Brasil | 1.707 | 3,9% |
| 8 | Noruega | 1.691 | 3,9% |
| 9 | Irán | 1.566 | 3,6% |
| 10 | Nigeria | 1.522 | 3,5% |
The Paradox of Venezuela and the Paradox of the United States
Venezuela is the best example of why reserves and exports must be viewed separately. With around 303,221 million barrels of proven reserves, it holds first place globally, yet its crude exports in 2024 stood at roughly 656,000 barrels per day. This does not detract from the value of its subsoil: it remains a colossal long-term energy asset. What changes is its weight in immediate international flows.
The United States presents the exact opposite case. Its proven reserves—45,014 million barrels—are far lower than those of Venezuela, Saudi Arabia, or Iran, yet in 2024 it exported around 4.109 million barrels per day and produced over 13 million barrels per day of crude and condensate, according to the EIA. Its influence does not stem from the size of its deposits, but from the machine that extracts, transports, and sells them.
Saudi Arabia is the only player winning on both fronts: second in reserves, first in exports, and, above all, endowed with spare capacity to increase or decrease supply as the market moves. That third dimension—the capacity to respond—is what transforms volume into real power.
And Colombia? 30th in reserves, 21st in exports
Colombia closed 2024 with around 2,019 million barrels of proven reserves, near 30th place globally and just 0.13% of the world's total. Viewed solely by reserves, it is a small oil economy.
However, it exported around 473,000 barrels of crude oil per day, which places it around 21st globally among the countries in the OPEC table. A nine-position difference between what it holds and what it actually delivers to the market.
The regional contrast is even more telling: Venezuela possesses 150 times Colombia's reserves and exports barely 1.4 times more crude. Brazil, with reserves eight times larger, exports 3.6 times more. Ecuador, with four times Colombia's reserves, exports less.
| País | Reservas 2024 (millones de barriles) | Exportaciones 2024 (mil b/d) |
|---|---|---|
| Venezuela | 303.221 | 656 |
| Brasil | 15.894 | 1.707 |
| Ecuador | 8.273 | 356 |
| Colombia | 2.019 | 473 |
The Colombian challenge: the relationship between reserves and production
The optimistic reading is that Colombia does a lot with little: it is an established exporter, with infrastructure, contracts, and buyers, and an industry capable of turning a modest resource into steady foreign currency. The demanding reading is that this performance depends on a limited inventory.
With reserves of 2,019 million barrels, the arithmetic is simple: maintaining its long-term exporting role requires sustained exploration, enhanced recovery in mature fields, and productivity. A country can compensate for small reserves with efficiency for a time; it cannot do so indefinitely.
That is, fundamentally, the message of the two maps. Reserves show potential power. Exports show part of current power. And the capacity to produce, transport, refine, and respond quickly to market changes is what truly decides who exerts real influence over the global energy system.
Sources and Methodology
OPEC, Annual Statistical Bulletin 2025: proven reserves, crude oil production and exports, with data through the end of 2024.
U.S. Energy Information Administration (EIA): global crude oil and condensate production.
Worldometer: independent verification of Colombia's position in reserves.
Export rankings are expressed by physical volume of crude oil and not by monetary value, to avoid mixing price, crude quality, and volume within the same ranking. The criteria were applied symmetrically to all countries.
Enlaces
Get KingNews in your inbox
Tech and gaming digest, no noise. Unsubscribe anytime.
Want to send us a news story?
Tell us your story. Our editorial team reviews it and gets back to you.
Would you like to advertise with us?
Write to us and we'll send you ad options and audience data.
More stories

Comercio electrónico · Eventos · Colombia
Feria Effix 2026: Medellín se convierte en la capital del comercio electrónico
Robótica · Inteligencia artificial · Sistemas autónomos
La colmena blindada: robots terrestres que podrían comandar enjambres de drones
Agrotecnología · Inteligencia artificial · Ganadería
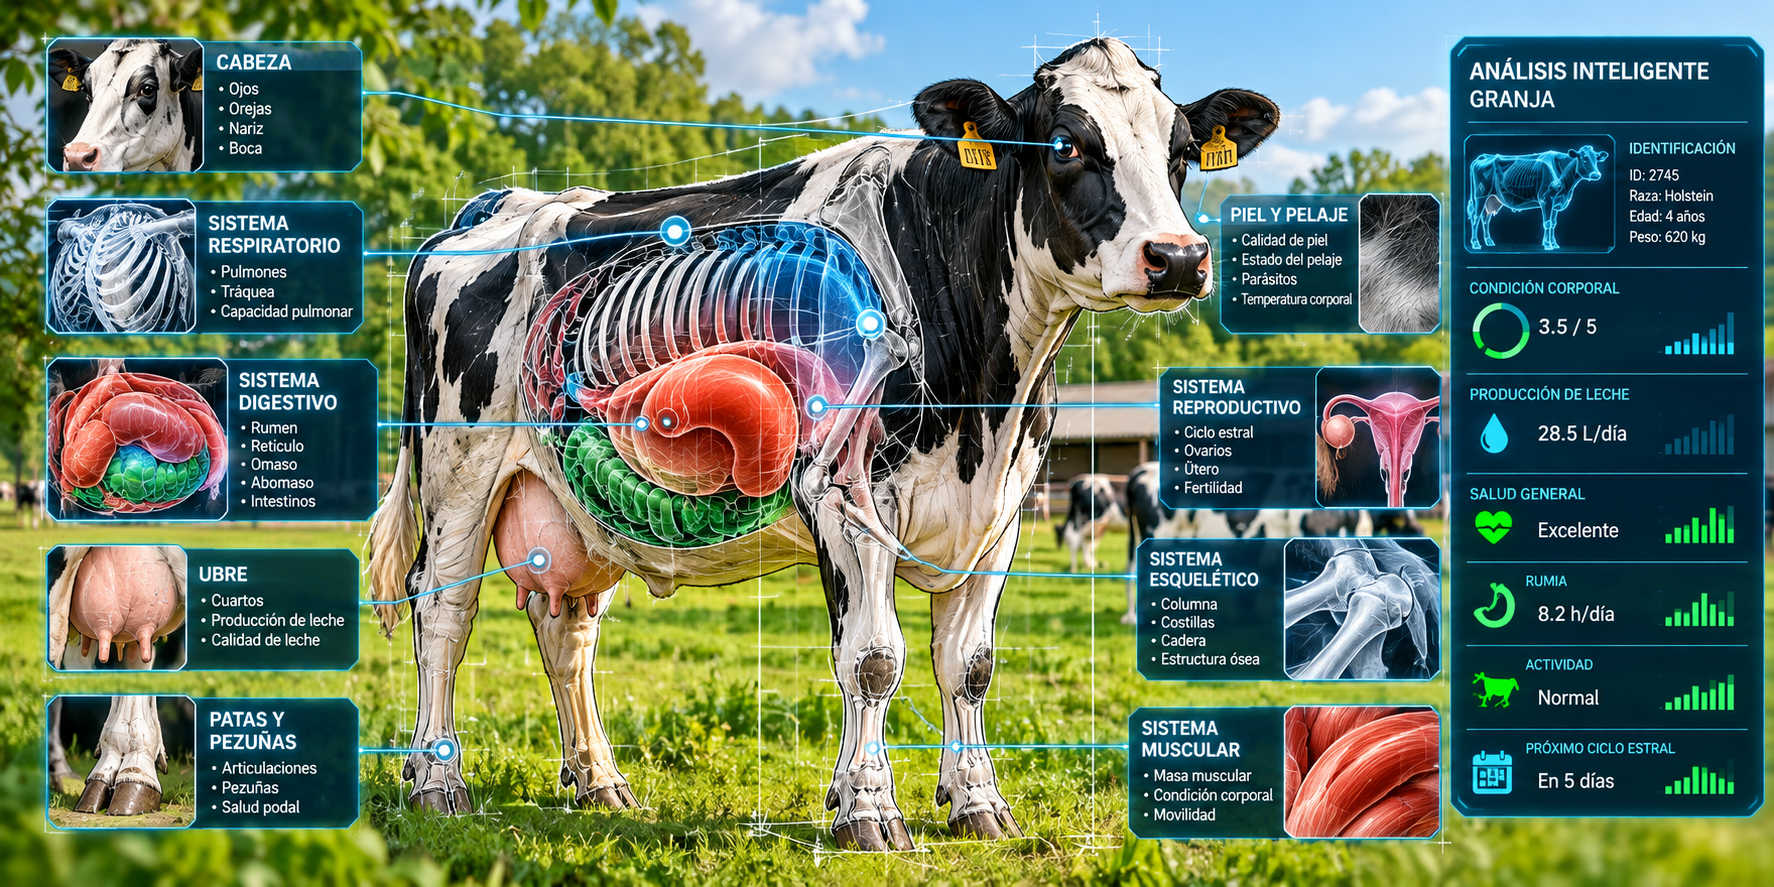
La granja autónoma toma forma: IA, drones y robots llegan al campo

Inteligencia artificial · Empresas · Opinión
BMW adelgaza su dirección con IA: ¿ha llegado la hora del gerente artificial supervisado?
Inteligencia física · Agricultura · Robótica industrial
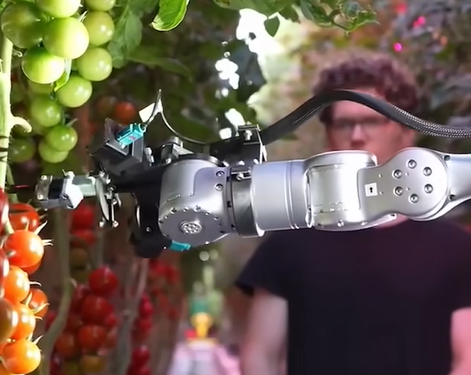
Polybot enseña a un robot a cosechar tomates mirando cómo trabajan los humanos

Inteligencia física · Robótica · Aprendizaje autónomo